Please use this identifier to cite or link to this item:
https://hdl.handle.net/11681/37073Full metadata record
| DC Field | Value | Language |
|---|---|---|
| dc.contributor.author | Darby, Stephen E. | - |
| dc.contributor.author | Artita, Kimberly | - |
| dc.contributor.author | Leyland, Julian | - |
| dc.contributor.author | Simon, Andrew | - |
| dc.contributor.author | Simon, Gail | - |
| dc.date.accessioned | 2020-06-18T14:32:51Z | - |
| dc.date.available | 2020-06-18T14:32:51Z | - |
| dc.date.issued | 2020-06 | - |
| dc.identifier.govdoc | MRG&P Report No. 34 | - |
| dc.identifier.uri | https://hdl.handle.net/11681/37073 | - |
| dc.identifier.uri | http://dx.doi.org/10.21079/11681/37073 | - |
| dc.description | MRG&P Report | - |
| dc.description.abstract | Since about 1900, widespread changes in hydrology across the Mississippi River Basin have occurred, resulting in important changes in the delivery of water and sediment to the Lower Mississippi River (LMR). This is due to a combination of natural and anthropogenic factors. There have been increases in annual precipitation and 1- to 7-day totals over large parts of the basin. Changes in seasonal distributions were also identified, as were increases in hurricane-related rainfall. Streamflow to the LMR has increased significantly over the past 100 years. Median water yields have increased across most of the mid-continent and decreased in the western-most parts of the Missouri and Arkansas River basins. Suspended-sediment loads to the LMR have dramatically declined. The Lower Mississippi River is receiving about 500 million tonnes per year less suspended sediment today than in the 1940s (616 Mt/y to 98 Mt/y). Human impacts on hydrology and sediment transport throughout the basin are important. In the mid-continent, water yield per unit precipitation showed increases, but markedly decreased in the western parts of the basin. Decreases can be attributed to the construction of thousands of dams, associated flow regulation, withdrawals for agriculture, and to a lesser extent, the increased evaporation behind impoundments. | en_US |
| dc.description.sponsorship | Mississippi River Geomorphology and Potamology Program (U.S.) | en_US |
| dc.description.tableofcontents | Abstract .................................................................................................................................... ii Figures and Tables ................................................................................................................... v Preface .................................................................................................................................... xi 1 Introduction ...................................................................................................................... 1 Background .................................................................................................................. 1 Objectives ..................................................................................................................... 3 Approach ...................................................................................................................... 4 Spatial divisions ........................................................................................................................... 5 Temporal divisions ....................................................................................................................... 9 2 Data Requirements, Sources, and Availability ........................................................... 10 Daily precipitation data ............................................................................................. 10 Mean-daily streamflow and peak-annual streamflow .............................................11 Suspended-sediment concentrations ..................................................................... 12 National inventory of dams ...................................................................................... 13 Daily pan-evaporation observations ........................................................................ 13 Geospatial data ......................................................................................................... 14 3 Methodology ................................................................................................................... 15 Precipitation analysis ................................................................................................15 Streamflow analysis .................................................................................................. 17 Calculation of water yield and precipitation-weighted water yield ........................ 18 Trend analyses ...........................................................................................................19 Peak-streamflow analysis ........................................................................................ 20 Annual-evaporation rates ......................................................................................... 20 Determination of annual suspended-sediment yields ............................................ 21 4 Results and Discussion ................................................................................................. 25 Precipitation trends .................................................................................................. 25 Annual trends ............................................................................................................................. 25 Peak annual trends .................................................................................................................... 26 Seasonal trends ......................................................................................................................... 31 Peak seasonal trends ................................................................................................................ 37 Hurricane-related precipitation trends ..................................................................................... 44 Summary of precipitation results ............................................................................................... 49 Water yield trends ..................................................................................................... 50 Annual trends ............................................................................................................................. 50 Peak annual trends .................................................................................................................... 51 Seasonal trends ......................................................................................................................... 55 Peak seasonal trends ................................................................................................................ 60 Summary of water-yield results ................................................................................................. 65 Trends in precipitation-weighted water yield........................................................... 67 Annual trends ............................................................................................................................. 67 Potential evaporation from NID impoundments ...................................................................... 74 Peak annual trends .................................................................................................................... 79 Seasonal trends ......................................................................................................................... 82 Peak seasonal trends ................................................................................................................ 87 Summary of precipitation-weighted water yield results: anthropogenic influences .............. 89 Streamflow trends from index stations ................................................................... 90 All index stations ........................................................................................................................ 90 Major (HUC-2) index stations..................................................................................................... 96 Summary of streamflow trends from index stations results ................................................. 105 Peak streamflow from HUC-4s ............................................................................... 106 Sediment yield ........................................................................................................ 108 Values and trends at the effective (Q1.5) discharge ............................................................... 109 Annual trends ........................................................................................................................... 114 Trends in annual sediment delivery to the Lower Mississippi from major index stations ..................................................................................................................................... 119 Summary of sediment-yield results ......................................................................................... 122 5 Summary ...................................................................................................................... 124 References .......................................................................................................................... 126 Appendix A: GHCND Gages ............................................................................................... 132 Appendix B: USGS Gage Information .............................................................................. 134 Appendix C: National Inventory of Dams ........................................................................ 139 Appendix D: Average Monthly Evaporation at NID Impoundments ............................. 142 Appendix E: Precipitation Trends by HUC-4 .................................................................... 148 Appendix F: Water Yield Trends by HUC-4 ....................................................................... 184 Appendix G: Precipitation-Weighted Water Yield Trends by HUC-4 ............................. 214 Appendix H: Streamflow Trends at Index Stations ........................................................ 232 Appendix I: Peak Streamflow Analysis by HUC-4 ...................................................... 268 Appendix J: Suspended-Sediment Yields .........................................................................271 Unit Conversion Factors .................................................................................................... 282 Acronyms and Abbreviations ............................................................................................ 283 Report Documentation Page | - |
| dc.format.extent | 297 pages / 70.12 MB | - |
| dc.format.medium | - | |
| dc.language.iso | en_US | en_US |
| dc.publisher | United States. Army. Corps of Engineers. Lower Mississippi Valley Division. | en_US |
| dc.publisher | United States. Mississippi River Commission. | - |
| dc.publisher | Coastal and Hydraulics Laboratory (U.S.) | - |
| dc.publisher | Engineer Research and Development Center (U.S.) | - |
| dc.relation.ispartofseries | MRG&P Report (Mississippi River Geomorphology and Potamology Program (U.S.)) ; no. MRG&P Report No. 34 | - |
| dc.rights | Approved for Public Release; Distribution is Unlimited | - |
| dc.source | This Digital Resource was created in Microsoft Word and Adobe Acrobat | - |
| dc.subject | Hydrology | en_US |
| dc.subject | Mississippi River | en_US |
| dc.subject | Mississippi River Watershed | en_US |
| dc.subject | Sediment transport | en_US |
| dc.subject | Suspended sediments | en_US |
| dc.title | Changes in hydrology and suspended-sediment transport in the Mississippi River Basin over the past century | en_US |
| dc.type | Report | en_US |
| Appears in Collections: | MRG&P Report | |
Files in This Item:
| File | Description | Size | Format | |
|---|---|---|---|---|
| MRG&P Report No 34.pdf | 70.12 MB | Adobe PDF | 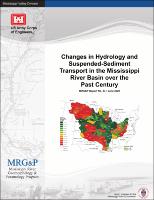 View/Open |