Please use this identifier to cite or link to this item:
https://hdl.handle.net/11681/42501Full metadata record
| DC Field | Value | Language |
|---|---|---|
| dc.contributor.author | Li, Honghai | - |
| dc.contributor.author | Maze, Grace M. | - |
| dc.contributor.author | Conner, Kevin B. | - |
| dc.contributor.author | Hazelton, John M. | - |
| dc.date.accessioned | 2021-12-01T15:54:31Z | - |
| dc.date.available | 2021-12-01T15:54:31Z | - |
| dc.date.issued | 2021-11 | - |
| dc.identifier.govdoc | ERDC/CHL TR-21-19 | - |
| dc.identifier.uri | https://hdl.handle.net/11681/42501 | - |
| dc.identifier.uri | http://dx.doi.org/10.21079/11681/42501 | - |
| dc.description | Technical Report | en_US |
| dc.description.abstract | This report documents a numerical modeling investigation for dredged material from nearshore borrow areas and placed on Folly Beach adjacent to Stono Inlet, South Carolina. Historical and newly collected wave and hydrodynamic data around the inlet were assembled and analyzed. The datasets were used to calibrate and validate a coastal wave, hydrodynamic and sediment transport model, the Coastal Modeling System. Sediment transport and morphology changes within and around the immediate vicinity of the Stono Inlet estuarine system, including sand borrow areas and nearshore Folly Beach area, were evaluated. Results of model simulations show that sand removal in the borrow areas increases material backfilling, which is more significant in the nearshore than the offshore borrow areas. In the nearshore Folly Beach area, the dominant flow and sediment transport directions are from the northeast to the southwest. Net sediment gain occurs in the central and southwest sections while net sediment loss occurs in the northeast section of Folly Island. A storm and a 1-year simulation developed for the study produce a similar pattern of morphology changes, and erosion and deposition around the borrow areas and the nearshore Folly Beach area. | en_US |
| dc.description.sponsorship | United States. Army. Corps of Engineers. Wilmington District. | en_US |
| dc.description.tableofcontents | Abstract .................................................................................................................................... ii Figures and Tables ................................................................................................................... v Preface .................................................................................................................................... xi 1 Introduction ...................................................................................................................... 1 1.1 Background ........................................................................................................ 1 1.2 Objectives ........................................................................................................... 3 1.3 Approach ............................................................................................................ 4 2 Data ................................................................................................................................... 5 2.1 Historical data .................................................................................................... 5 2.1.1 Bathymetry .................................................................................................................. 5 2.1.2 Tide .............................................................................................................................. 6 2.1.3 Wind and waves .......................................................................................................... 8 2.1.4 Sediment ................................................................................................................... 10 2.2 2.2 Field data collection .................................................................................11 3 Coastal Modeling System (CMS) Modeling ................................................................ 15 3.1 Model domain and model setup ..................................................................... 16 3.2 Simulation periods ......................................................................................... 18 3.2.1 Hurricane Hugo ......................................................................................................... 18 3.2.2 A typical year (2018) ................................................................................................. 20 3.3 Model forcing ................................................................................................... 21 3.4 Model alternatives .......................................................................................... 23 3.4.1 Borrow area: Folly River (Alternative 1) ................................................................... 26 3.4.2 Borrow area: Stono Inlet Throat (Area I, Alternative 2) ........................................... 27 3.4.3 Borrow area: Stono Ebb Shoal 1 (Area J, Alternative 3) ......................................... 28 3.4.4 Borrow area: Stono Ebb Shoal 2 (Area K, Alternative 4) ........................................ 29 3.4.5 Borrow area: Stono Inlet (Area E, Alternative 5) ..................................................... 30 4 Simulation Results and Analysis .................................................................................. 32 4.1 Model calibration and validation ................................................................... 32 4.2 Hurricane Hugo ............................................................................................... 38 4.2.1 Waves ........................................................................................................................ 38 4.2.2 Current ....................................................................................................................... 45 4.2.3 Sediment transport ................................................................................................... 51 4.2.4 Morphology change .................................................................................................. 58 4.3 A typical year (2018) ...................................................................................... 72 4.3.1 Waves ........................................................................................................................ 73 4.3.2 Current ....................................................................................................................... 77 4.3.3 Sediment transport ................................................................................................... 82 4.3.4 Morphology change .................................................................................................. 85 5 Conclusions .................................................................................................................... 97 References ............................................................................................................................. 99 Acronyms and Abbreviations ............................................................................................ 100 Report Documentation Page | - |
| dc.format.extent | 114 pages / 27.82 MB | - |
| dc.format.medium | - | |
| dc.language.iso | en_US | en_US |
| dc.publisher | Coastal and Hydraulics Laboratory (U.S.) | en_US |
| dc.publisher | Engineer Research and Development Center (U.S.) | - |
| dc.relation.ispartofseries | Technical Report (Engineer Research and Development Center (U.S.)) ; no. ERDC/CHL TR-21-19 | - |
| dc.rights | Approved for Public Release; Distribution is Unlimited | - |
| dc.source | This Digital Resource was created in Microsoft Word and Adobe Acrobat | - |
| dc.subject | Dredging | en_US |
| dc.subject | Dredging spoil | en_US |
| dc.subject | Folly Beach (S.C.) | en_US |
| dc.subject | Hydrodynamics | en_US |
| dc.subject | Sedimentation and deposition | en_US |
| dc.subject | Sediment transport | en_US |
| dc.subject | Stono Inlet (S.C.) | en_US |
| dc.title | Sediment transport modeling at Stono Inlet and adjacent beaches, South Carolina | en_US |
| dc.type | Report | en_US |
| Appears in Collections: | Technical Report | |
Files in This Item:
| File | Description | Size | Format | |
|---|---|---|---|---|
| ERDC-CHL TR-21-19.pdf | 27.82 MB | Adobe PDF | 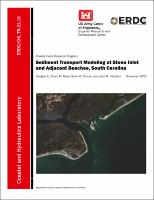 View/Open |